Creating a Report
In order to create a report, i.e. to structure the report table and choose what information should appear in the rows and columns of the table, add report components, which are:
Text entries – title, subtitle, header, and footer. For these fields, the expected input is a free text.
Note: By default, the Report Designer gives you the possibility of adding report titles. However, you can change the default view to make adjustments for other text entry components (sub-title, header and footer) as well. To be able to provide additional textual information to the report, you will have to click the Show Details link and provide the appropriate information in the fields that emerge. Clicking the Hide Details link will collapse the text entry fields displaying only the Title.
Report grouping - allows grouping data according to a specific category. Grouped data appear in different tables. Each table contains data that fall under one group of the category specified.
Rows - group data within the report table.
Columns - show details specific to each table row.
Sub-columns - divide the row details displayed under each column.
In order to add report components, follow the steps below. They provide instructions on how to compose and submit queries.
1. Type the text that should appear as the report title in the Title text box.
2. Enter a Subtitle, Header, and Footer if needed.
3. In the Group Report by section, specify the category, which will be used to group data into different tables. To add a report grouping, click the Add Grouping link in the Group Report by section and select the appropriate category from the menu that appears (Figure: Selecting a Grouping for a Report).
Note: The report will be divided into as many tables as there are table groupings selected.
4. Select table rows by clicking on the Add Row link and selecting the appropriate item from the menu that appears. Please note that it is possible to select one row at a time from the list of available rows.
5. Select table columns by clicking on the Add Column link and selecting the appropriate item from the menu that appears. Please note that it is possible to select one column at a time from the list of available columns.
Note: Once the report column is selected, an Add Sub-column link becomes available under the selected column. It allows indicating how the row details displayed under each column will be divided.
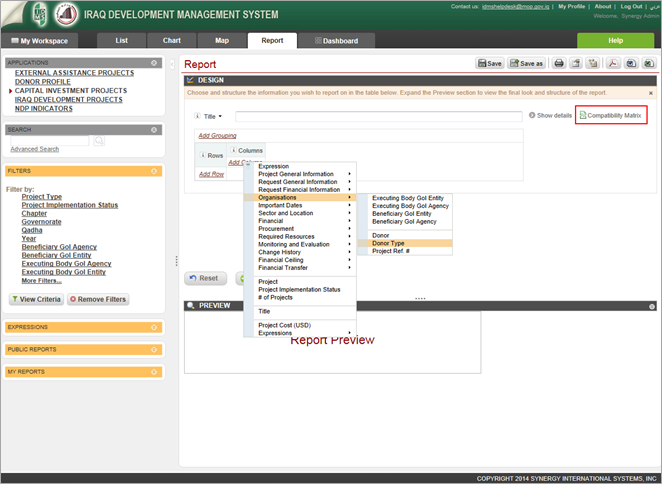 |
Figure: Selecting a Grouping for a Report |
Note:
At any point it is possible to remove all components selected
for the report and design a new report from scratch by clicking
the  (Reset) button.
Note: If you have defined a report which has incompatible columns (columns over which reports cannot be generated), they will be marked in red and an error message will occur. To make your reports productive, use the link (as marked in red, Figure: Selecting a Grouping for a Report) to open the Compatibility Matrix table (Figure: Compatibility Matrix). This is a table that displays the compatibility between all categories and measures in the database to display them in the report.
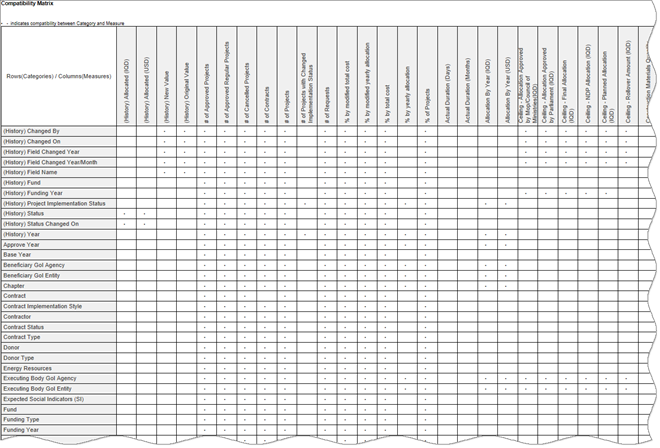 |
Figure: Compatibility Matrix |