Sample Chart Report 1
If you have selected Governorate as a chart category, # of Projects / # of Requests as values to be shown on the chart, clicked the 3D Column chart button to specify the chart type, and activated the Data Table option in the View window, the following chart report will appear (Figure: Sample Chart Report 1):
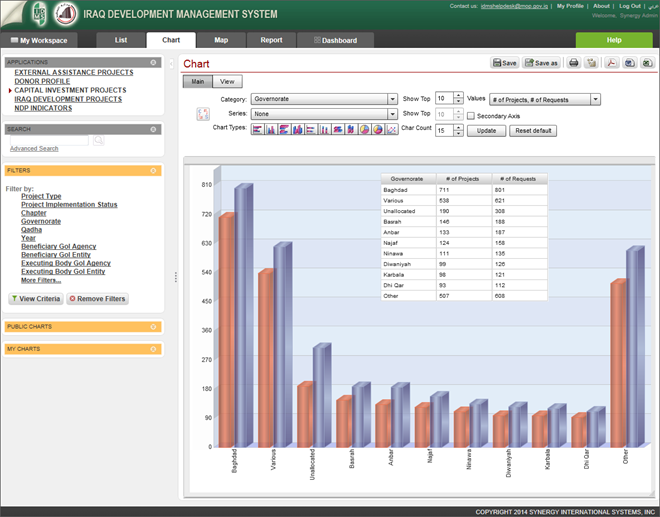 |
Figure: Sample Chart Report 1 |